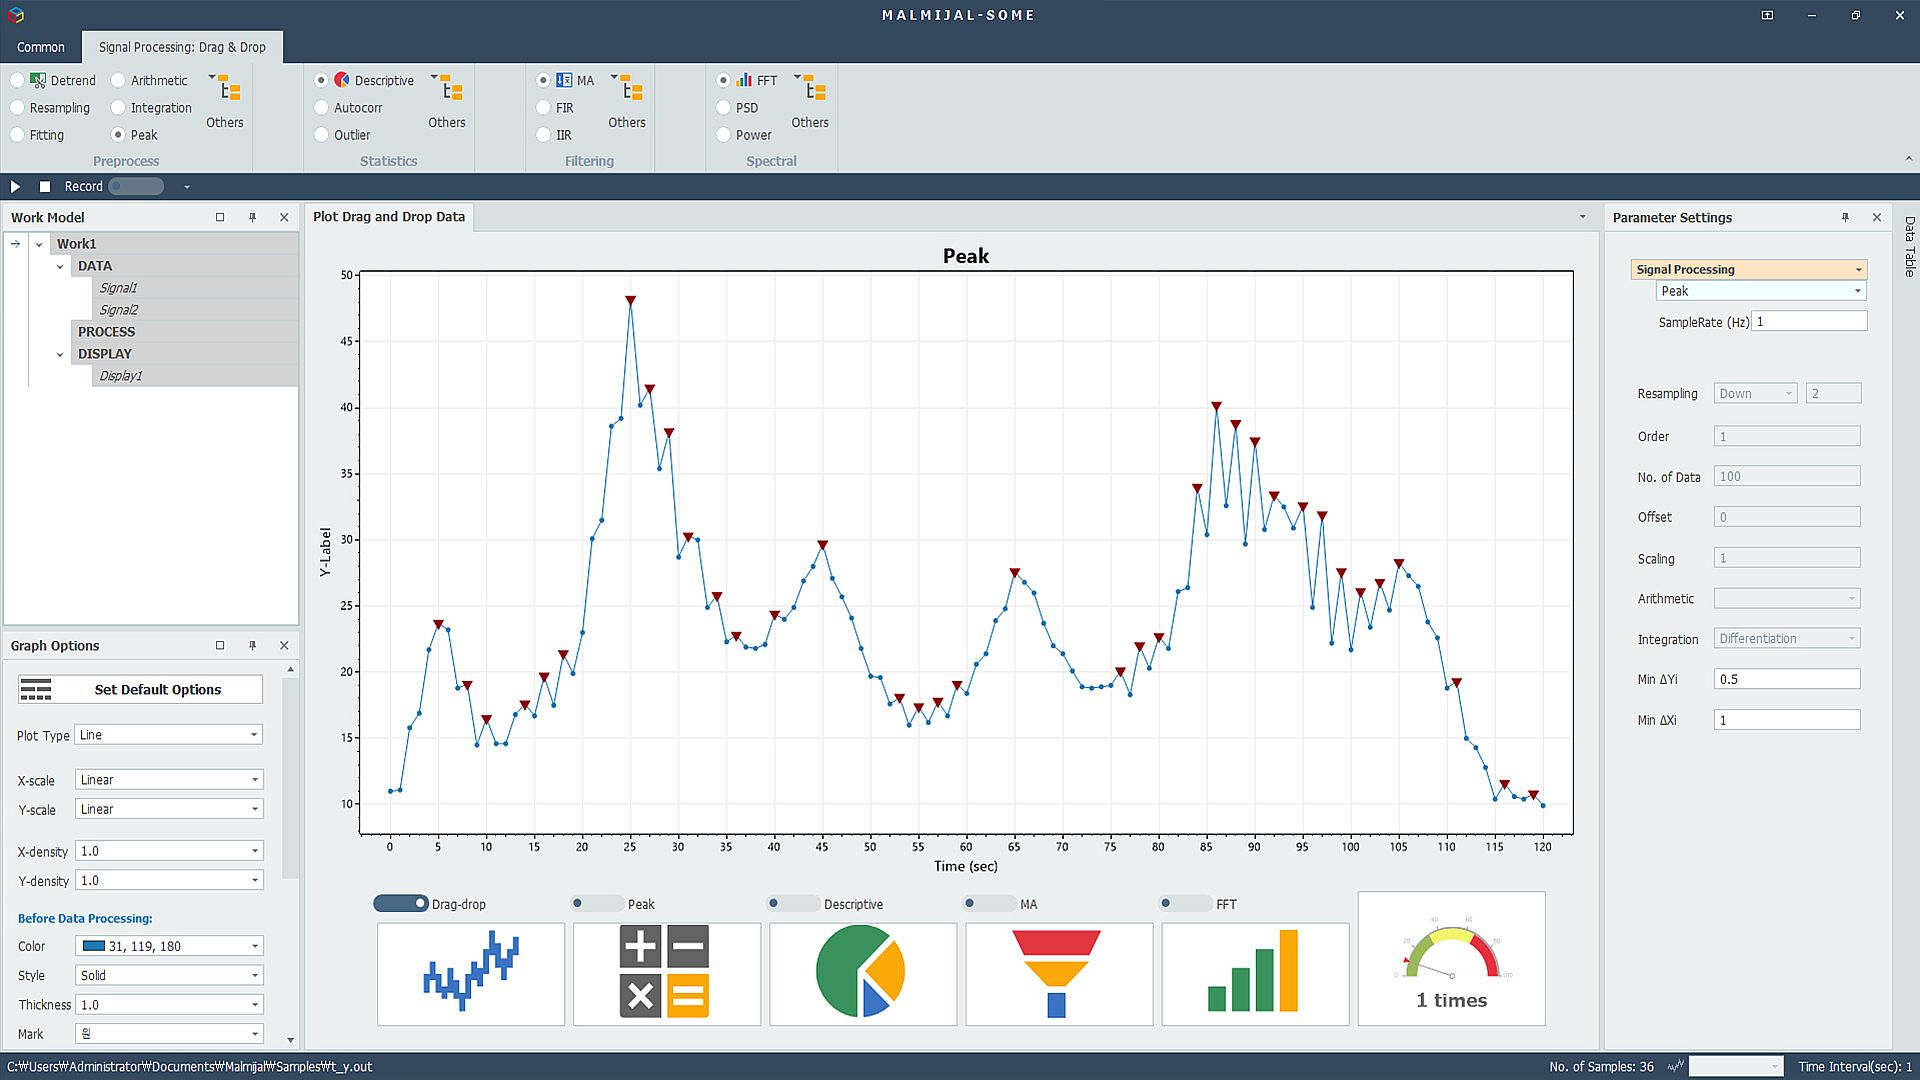
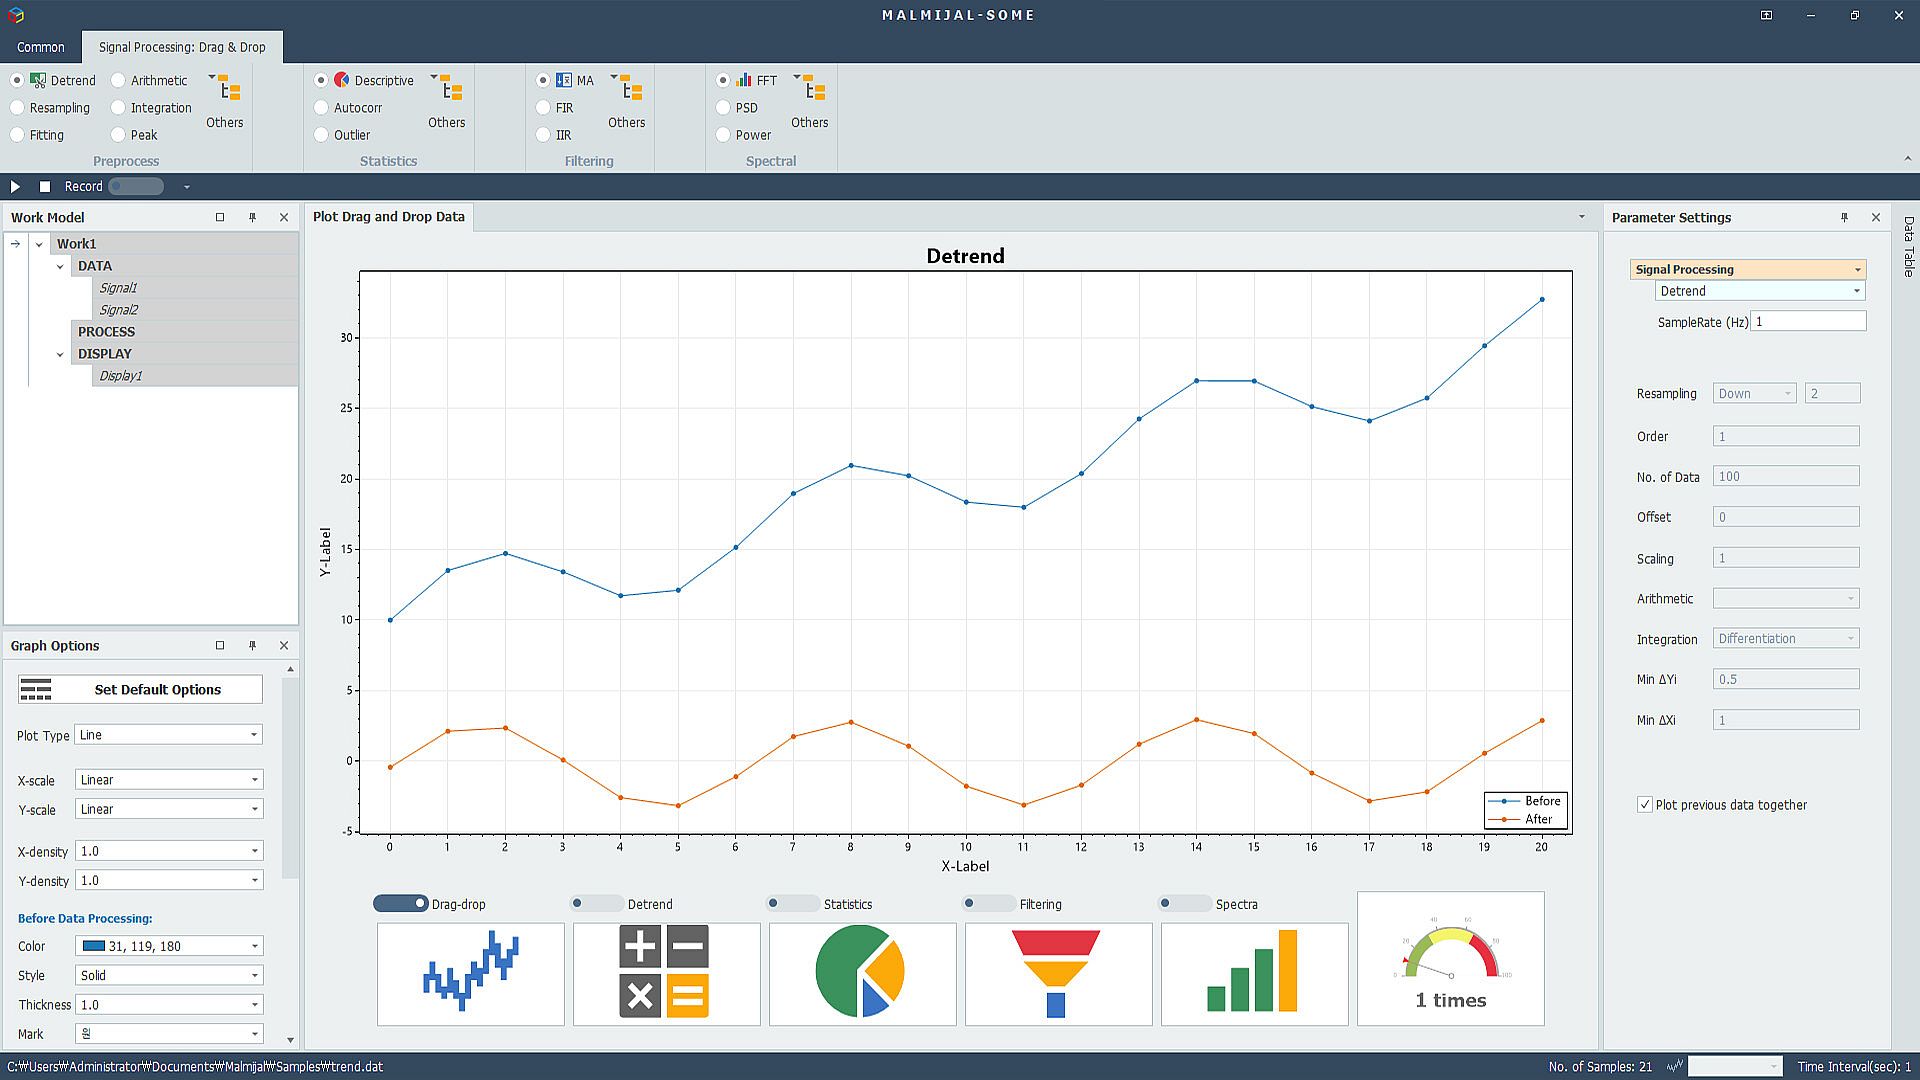

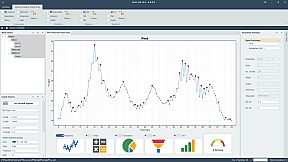

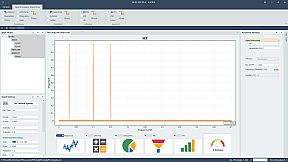
MALMIJAL is a platform that can process various data in a drag-and-drop method. Based on data visualization, MALMIJAL processes results by dragging and dropping or clicking pre-processing, statistical processing, filtering, spectral analysis, etc. You can visualize it as a graph or save it as a file.
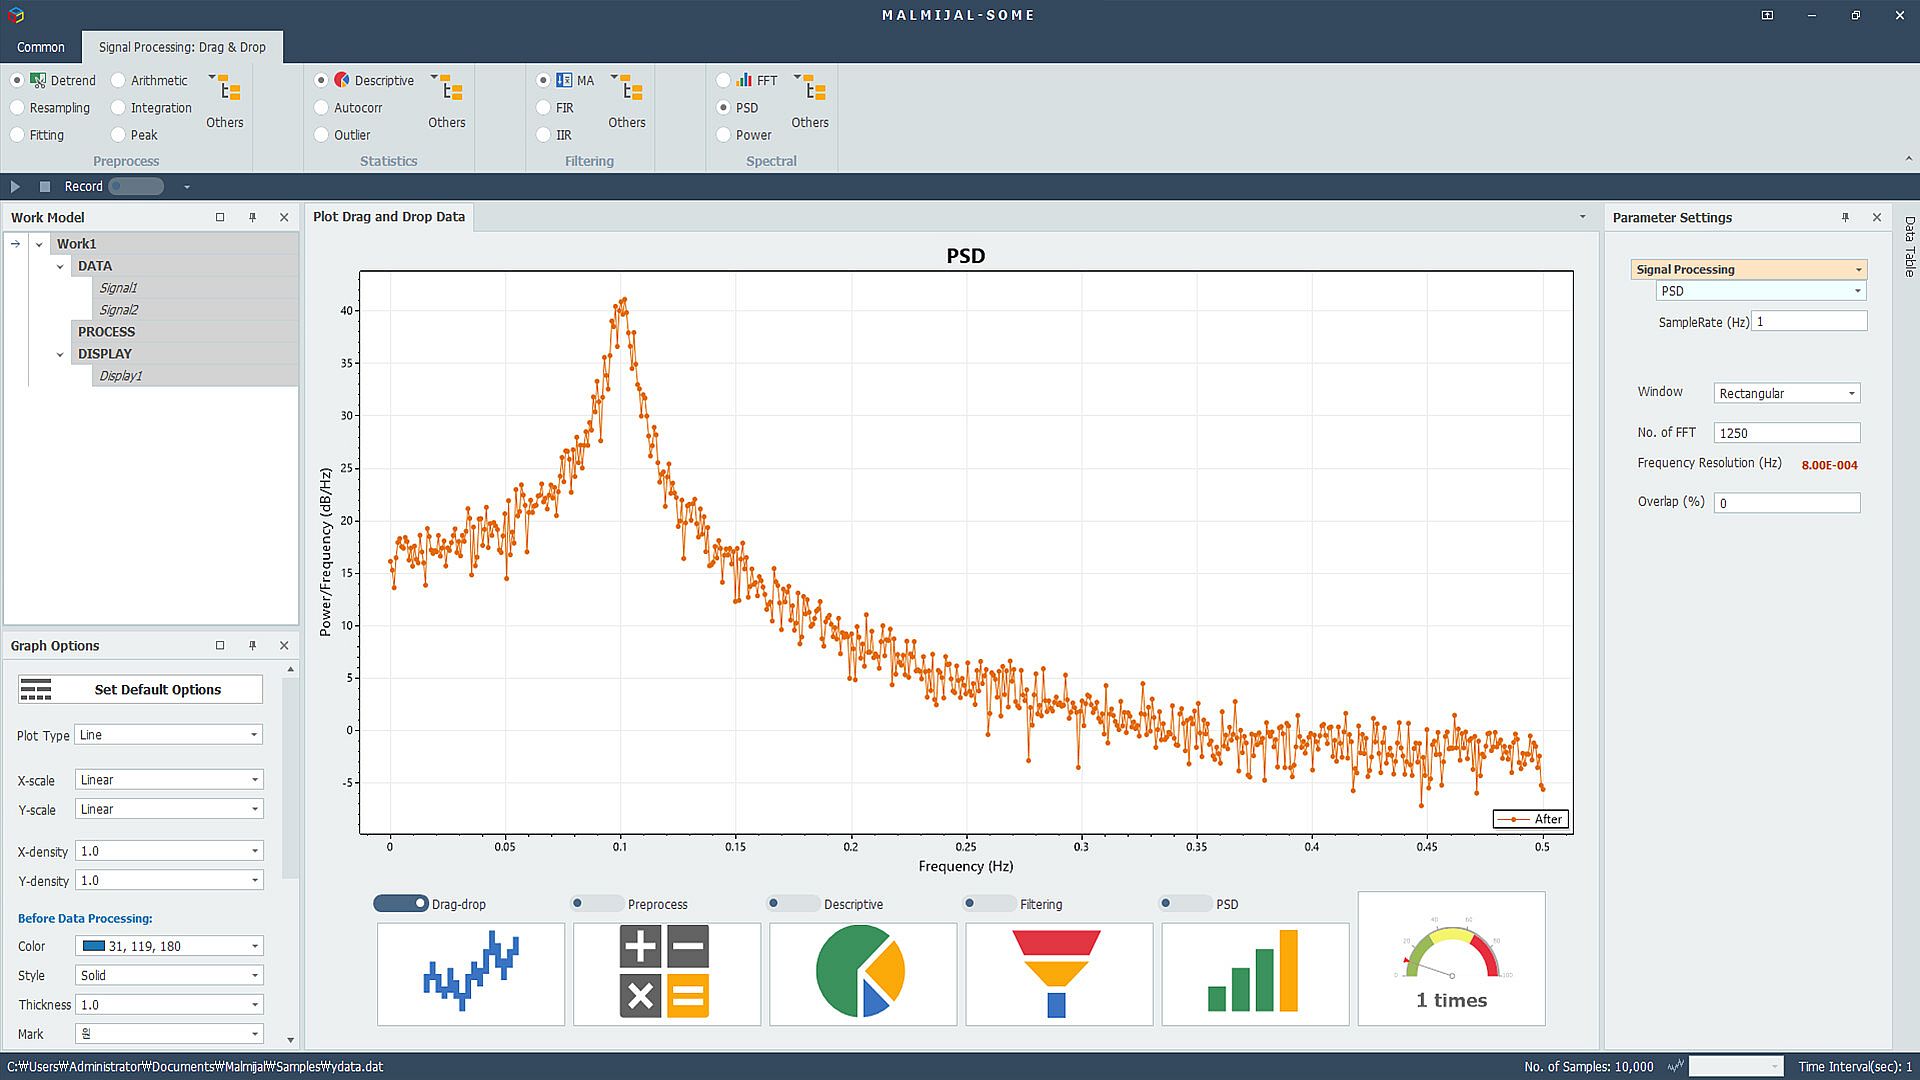
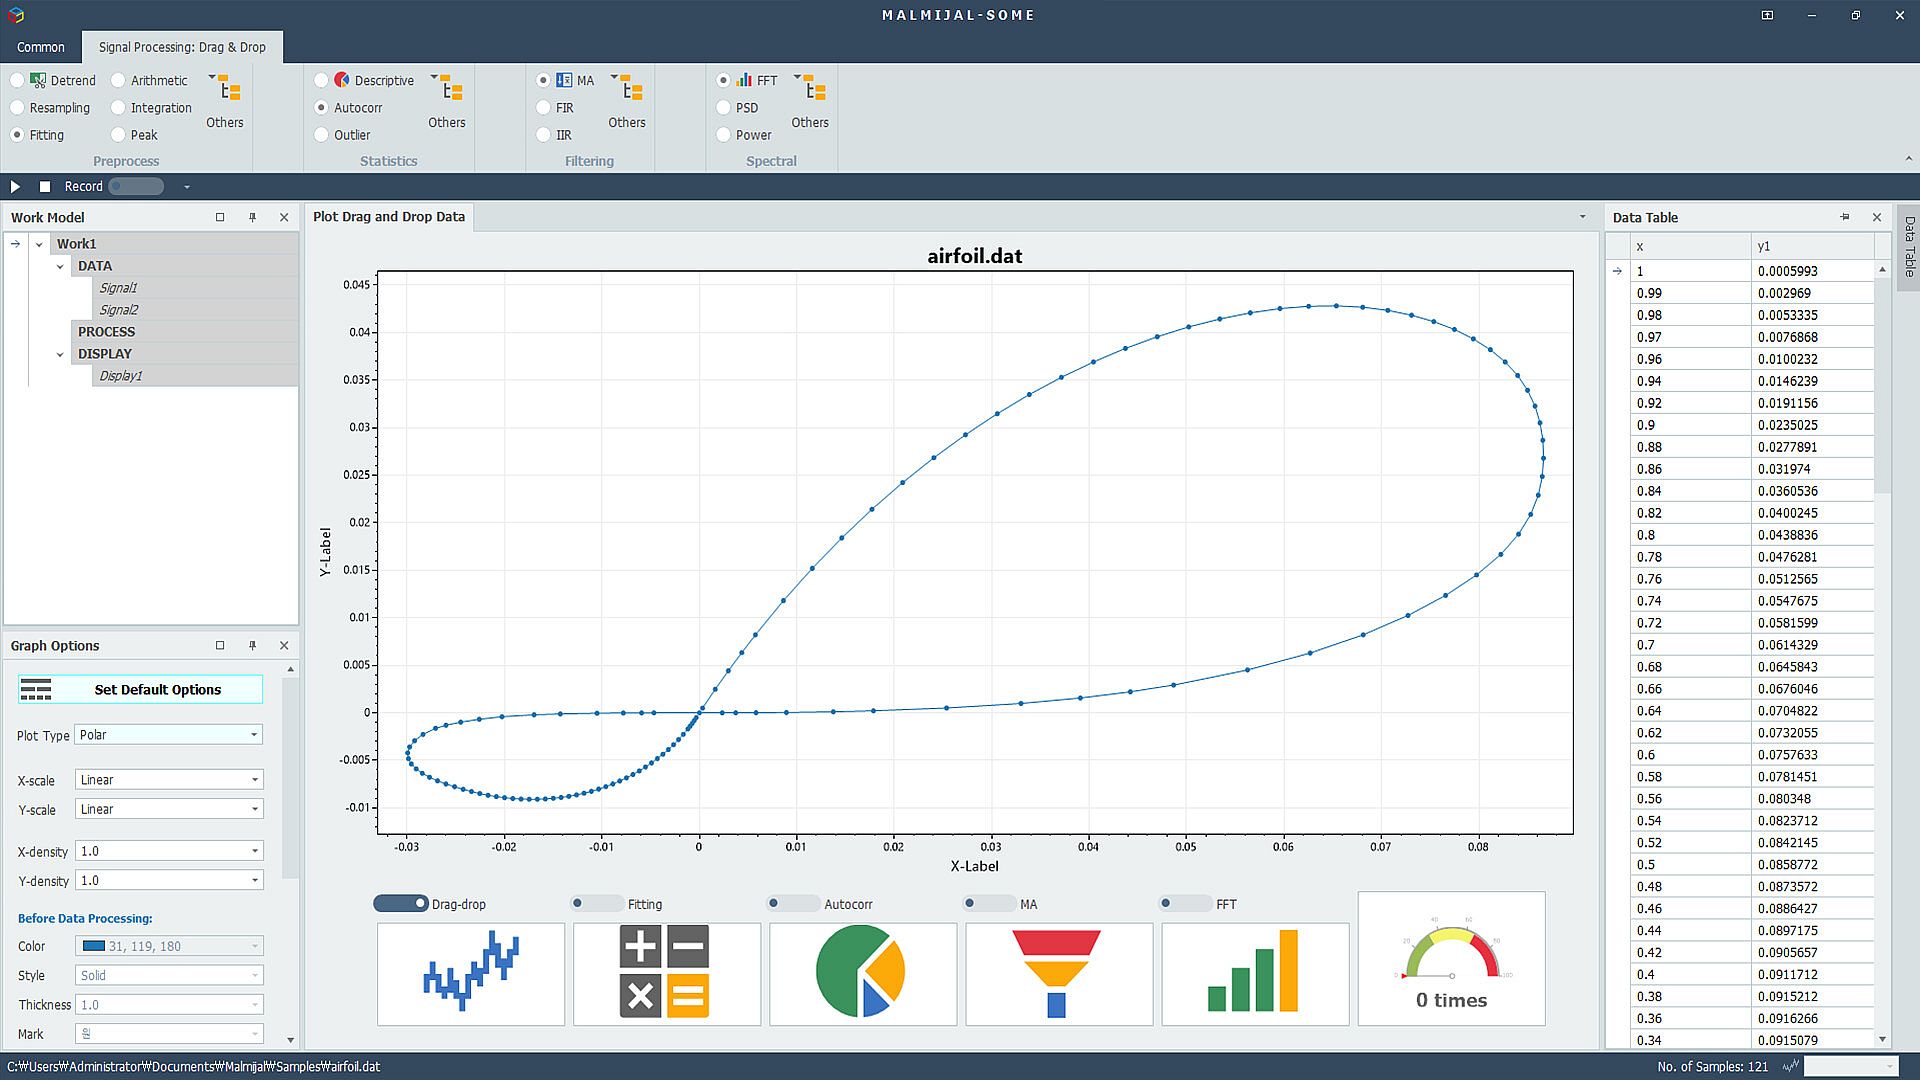
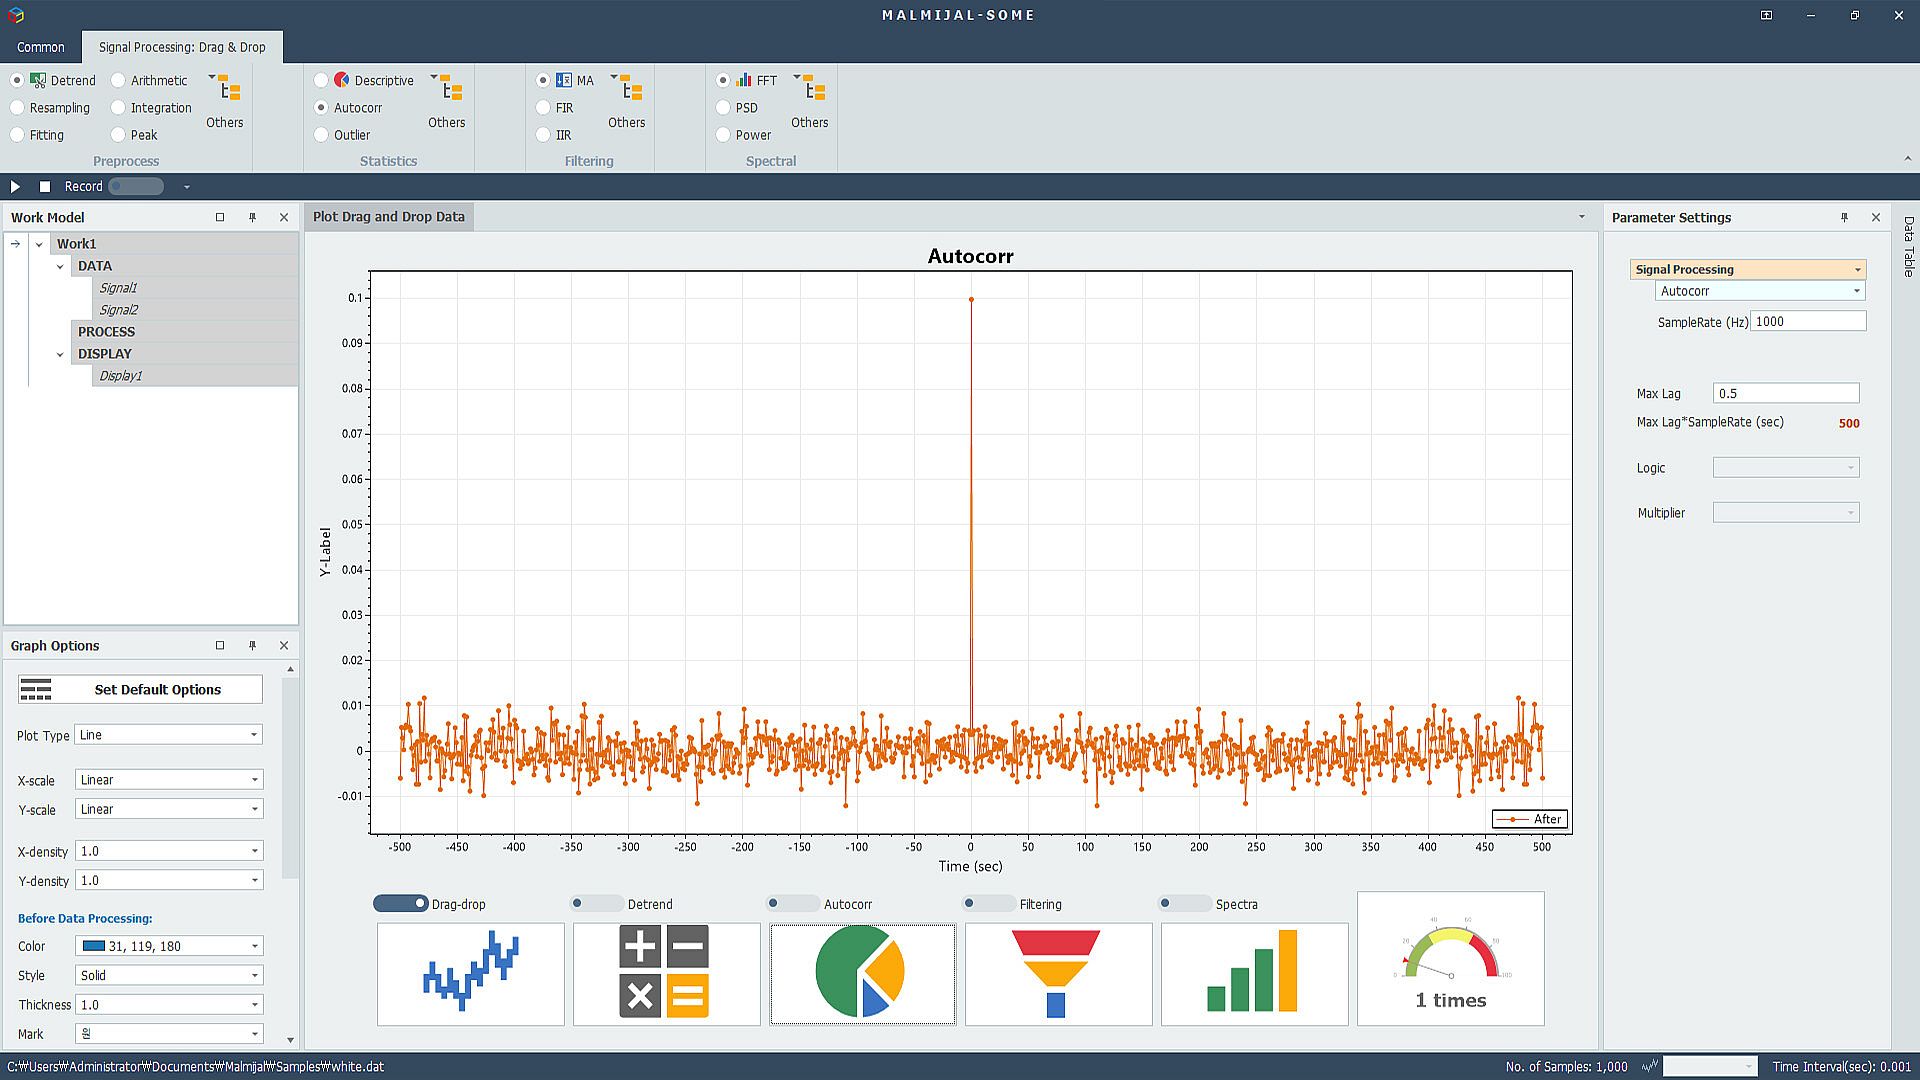
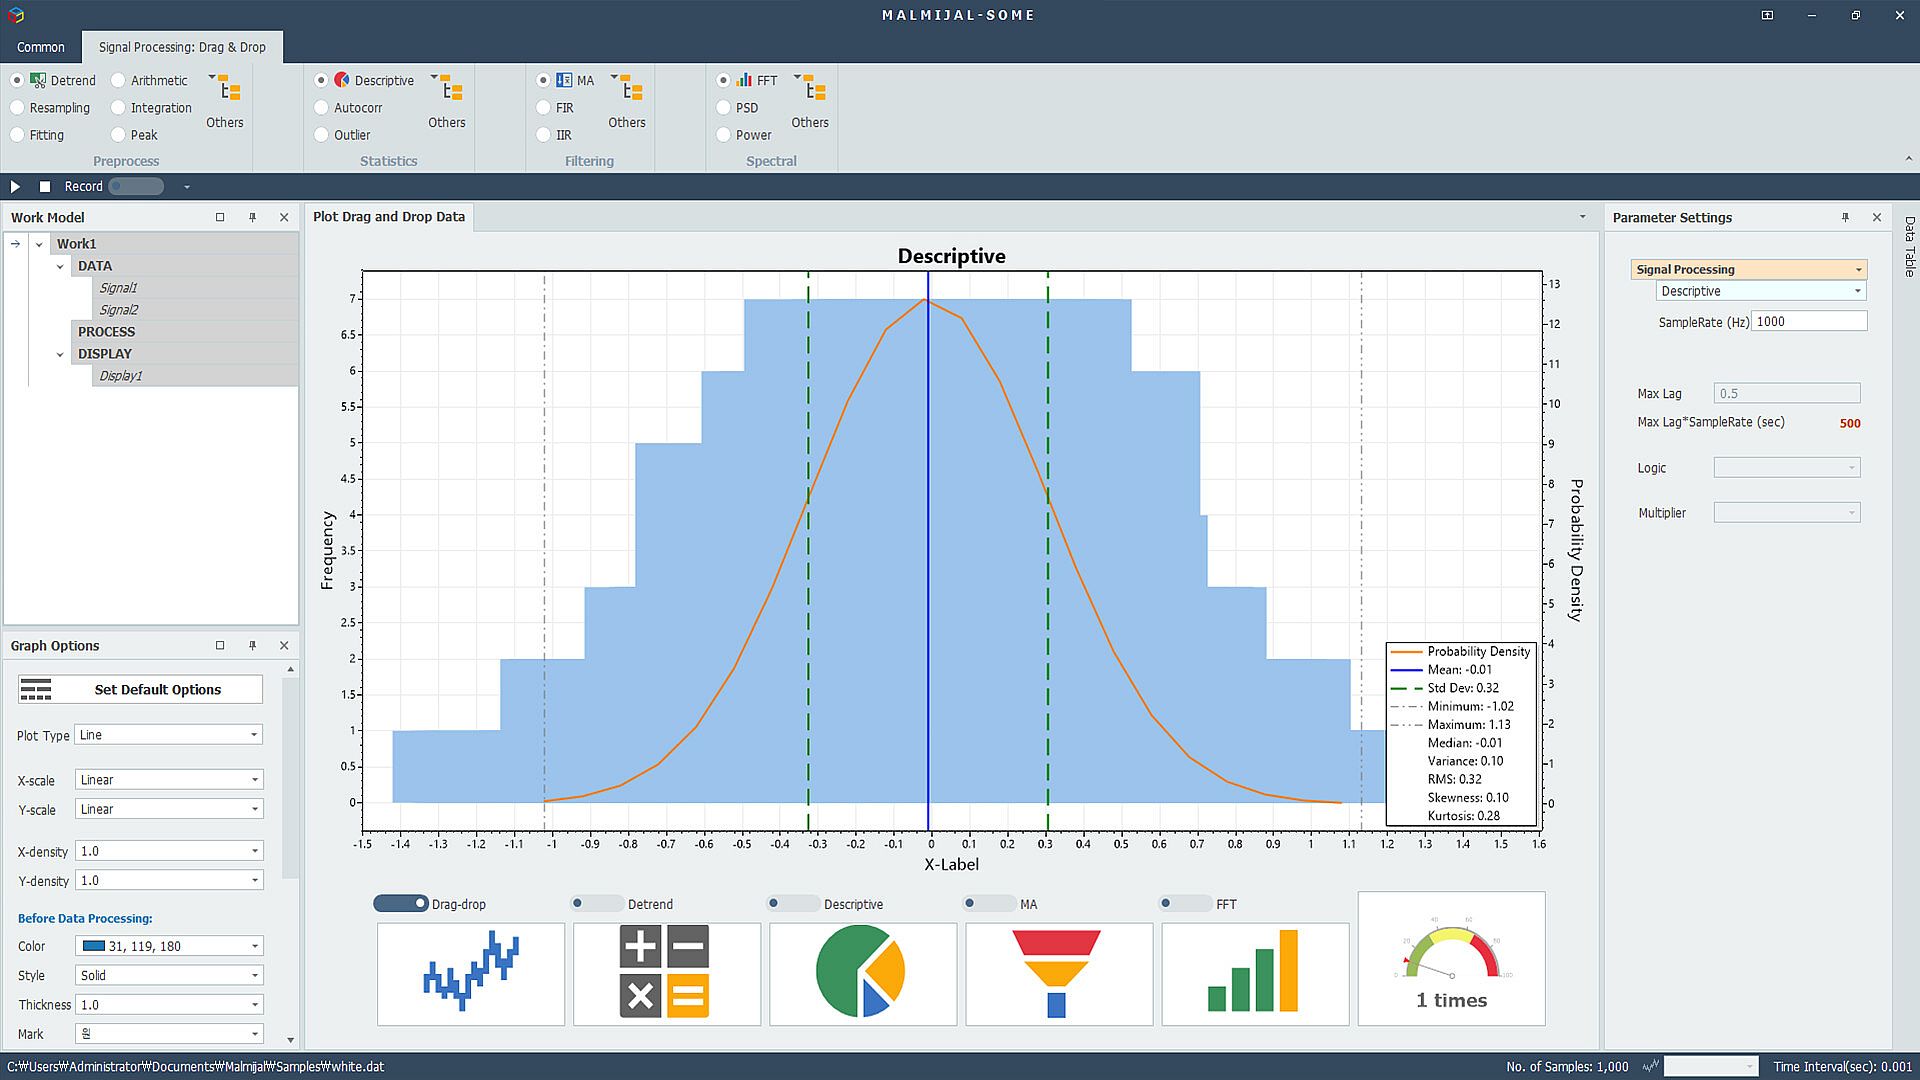
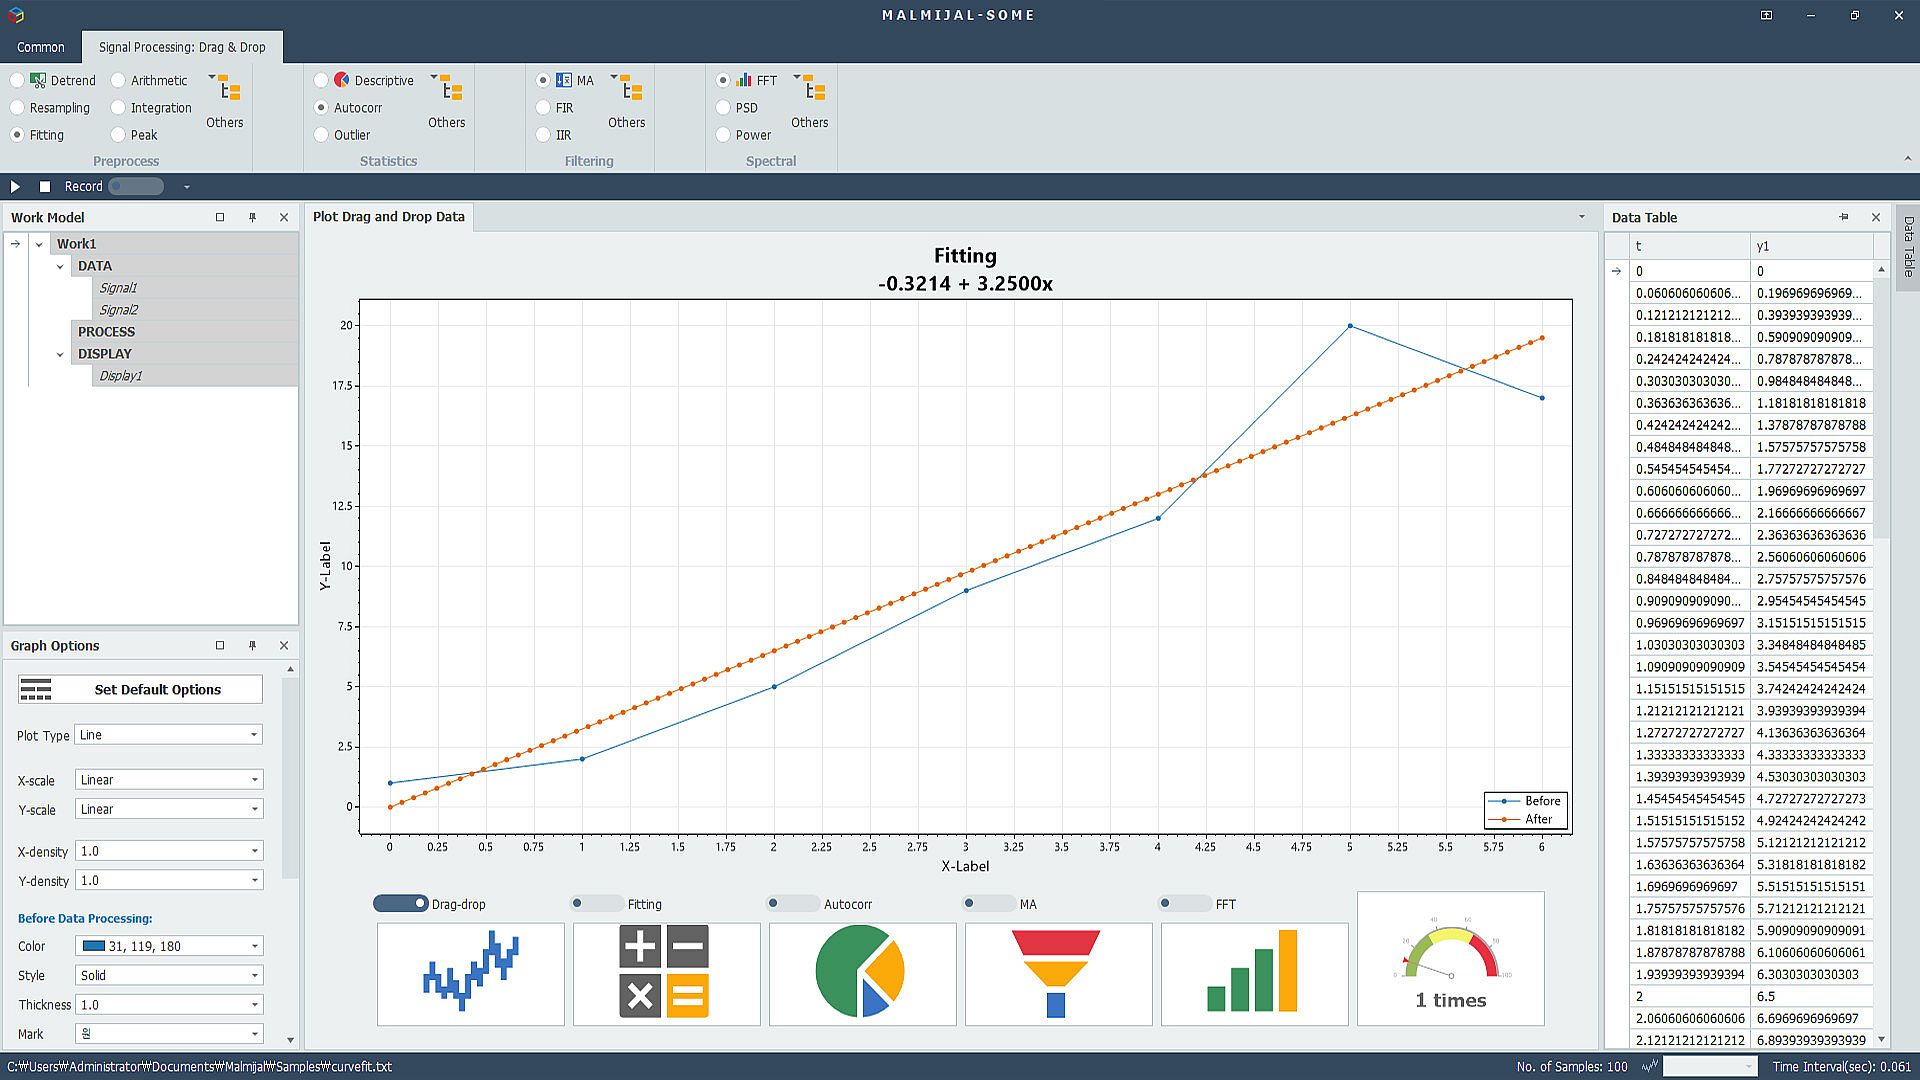
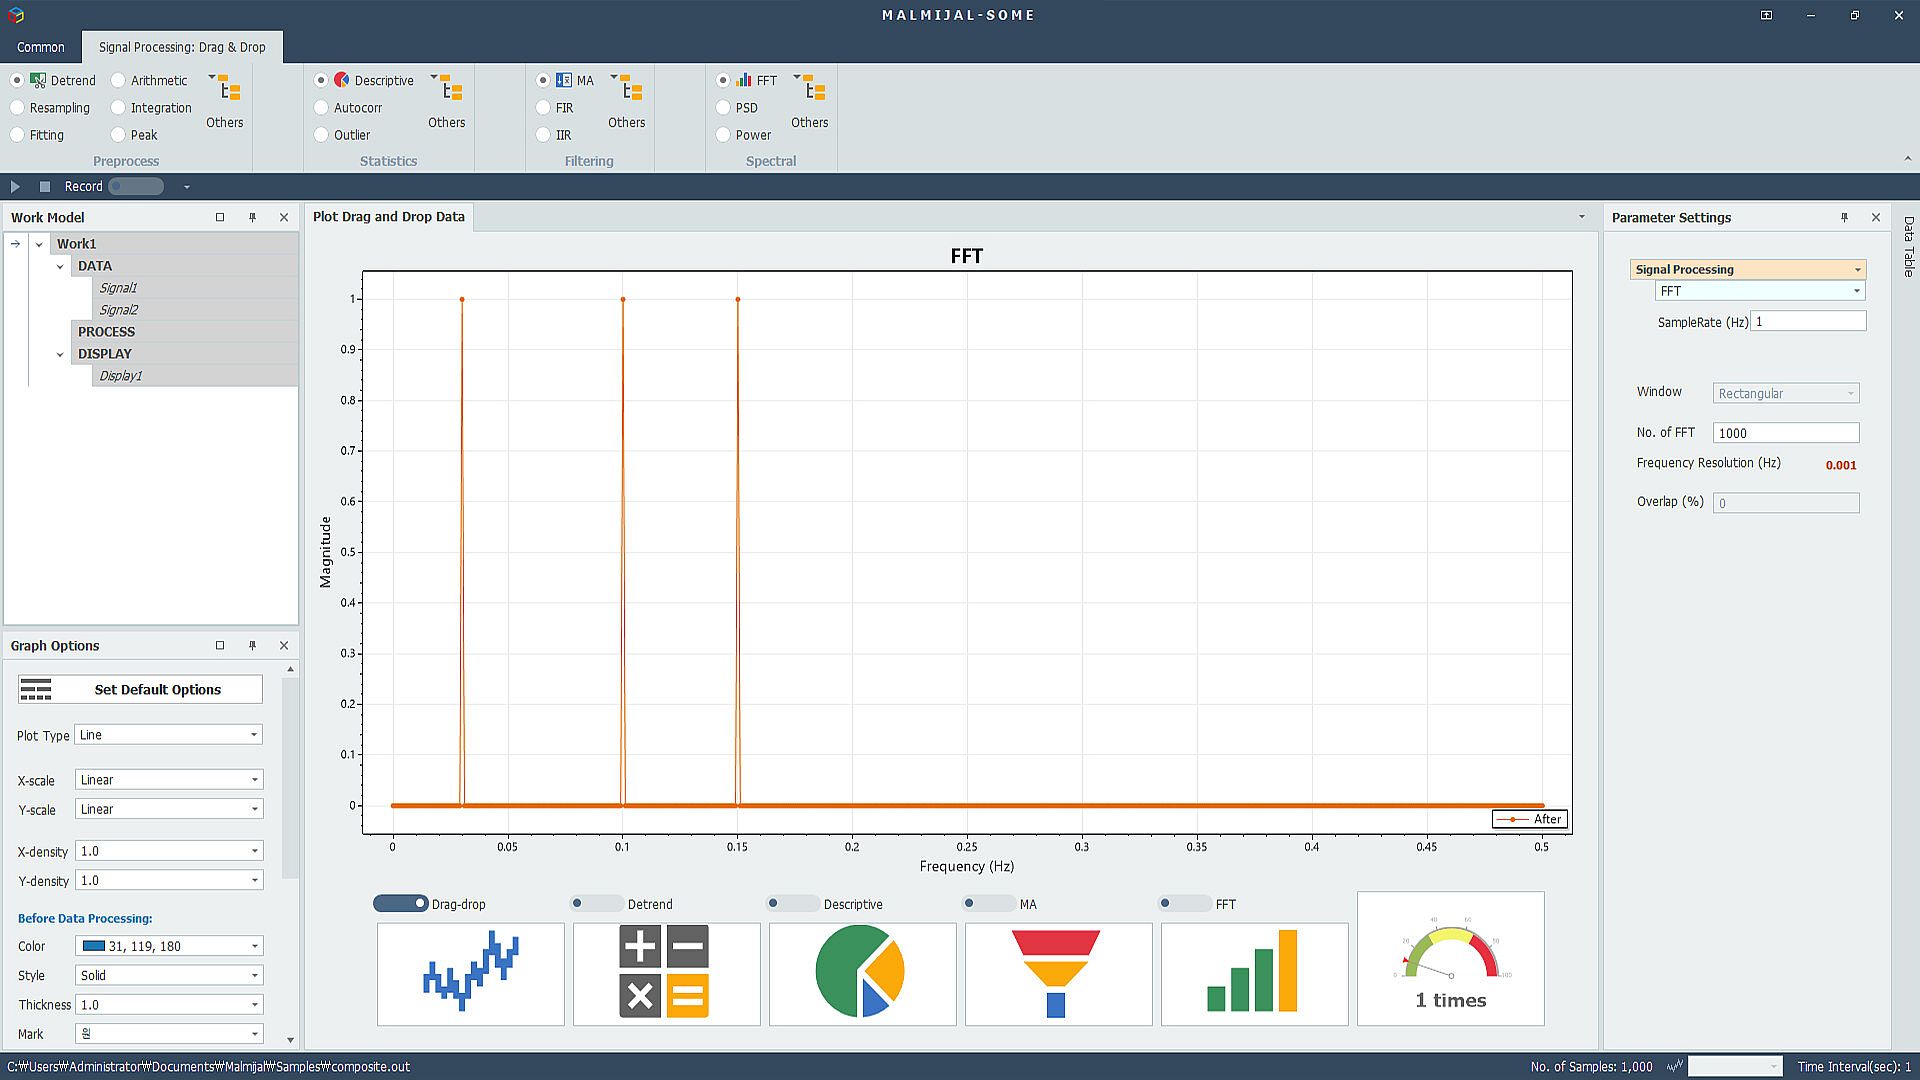
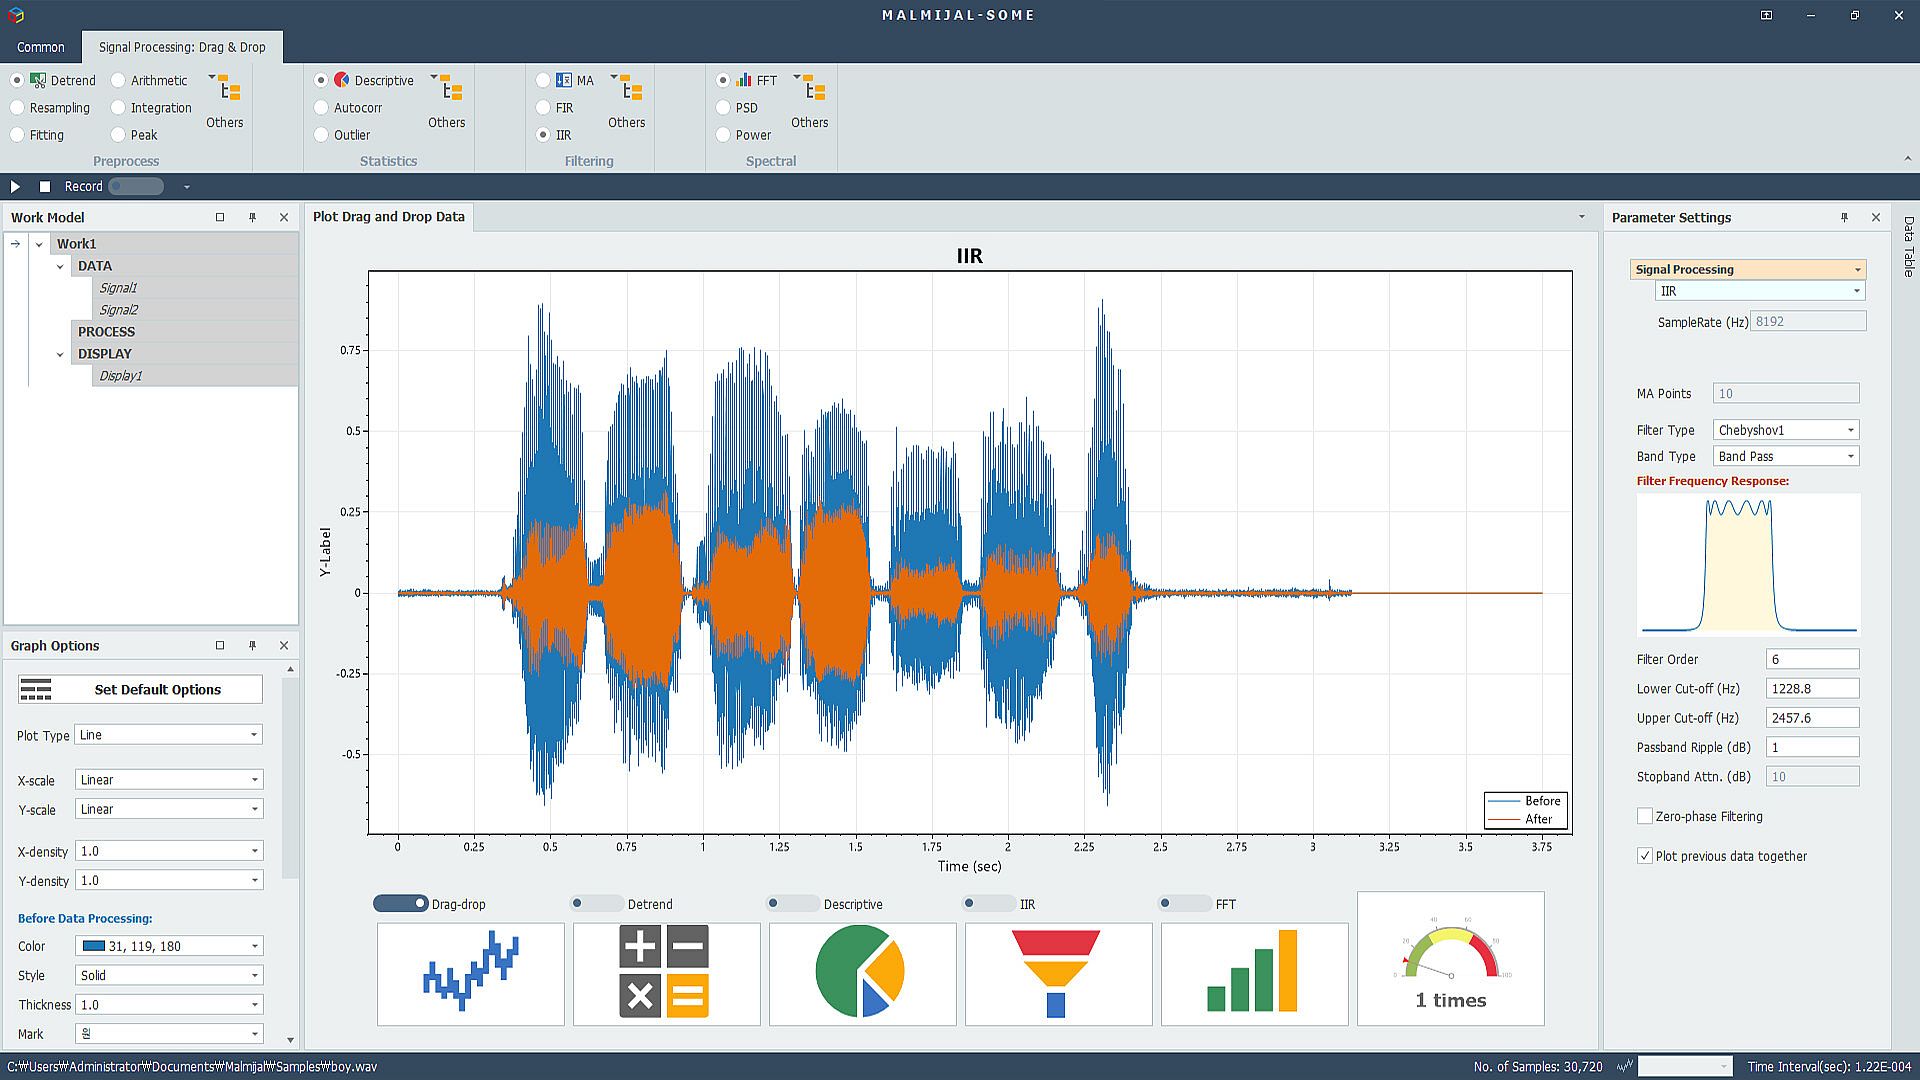
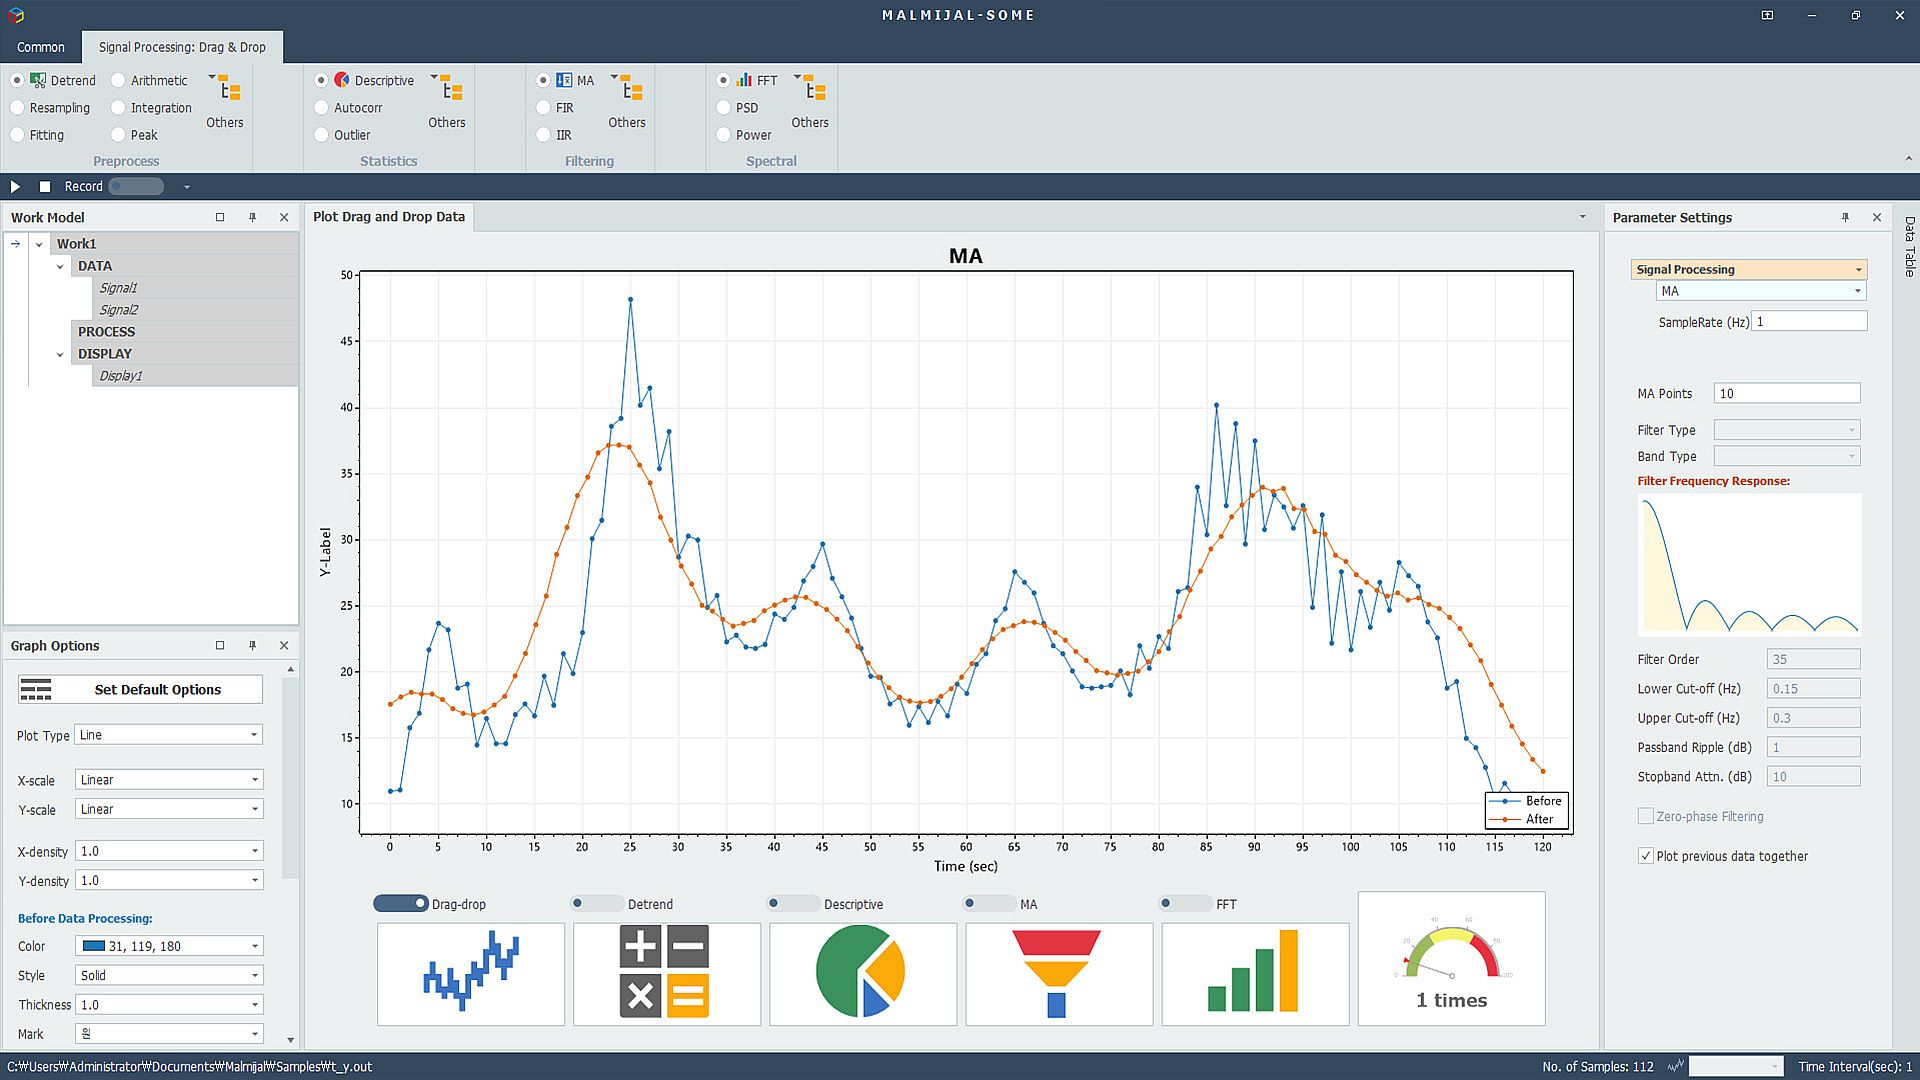
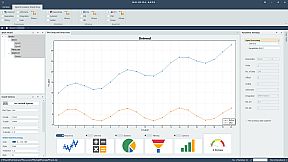
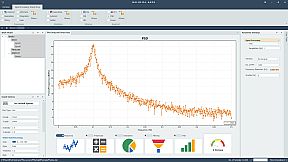
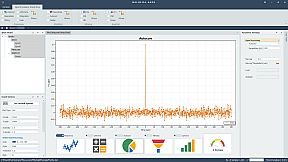
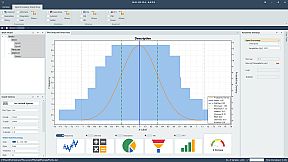
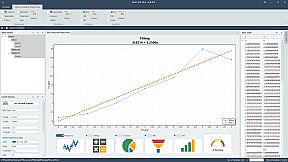
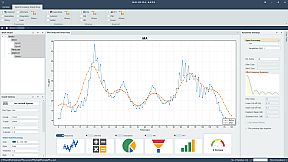
Pre-processing can perform functions such as trend removal, resampling, curve fitting, arithmetic operation, differentiation and integration, and peak finding. Statistical processing is visualized by processing the descriptive statistics. The main functions are to display maximum, minimum, median, standard deviation, variance, RMS, skewness, and kurtosis values. Filters are capable of moving average, FIR, and IIR filtering, and in particular, IIR filters are Butterworth, Chevyshov 1, Chevyshov 2, and elliptic filters. Band types can be low pass, high pass, band pass, and band stop, and zero-phase filtering is also possible. Spectral analysis can be performed by FFT, PSD, and power spectrum. Depending on frequency analysis, overlapping or various window types can be applied.
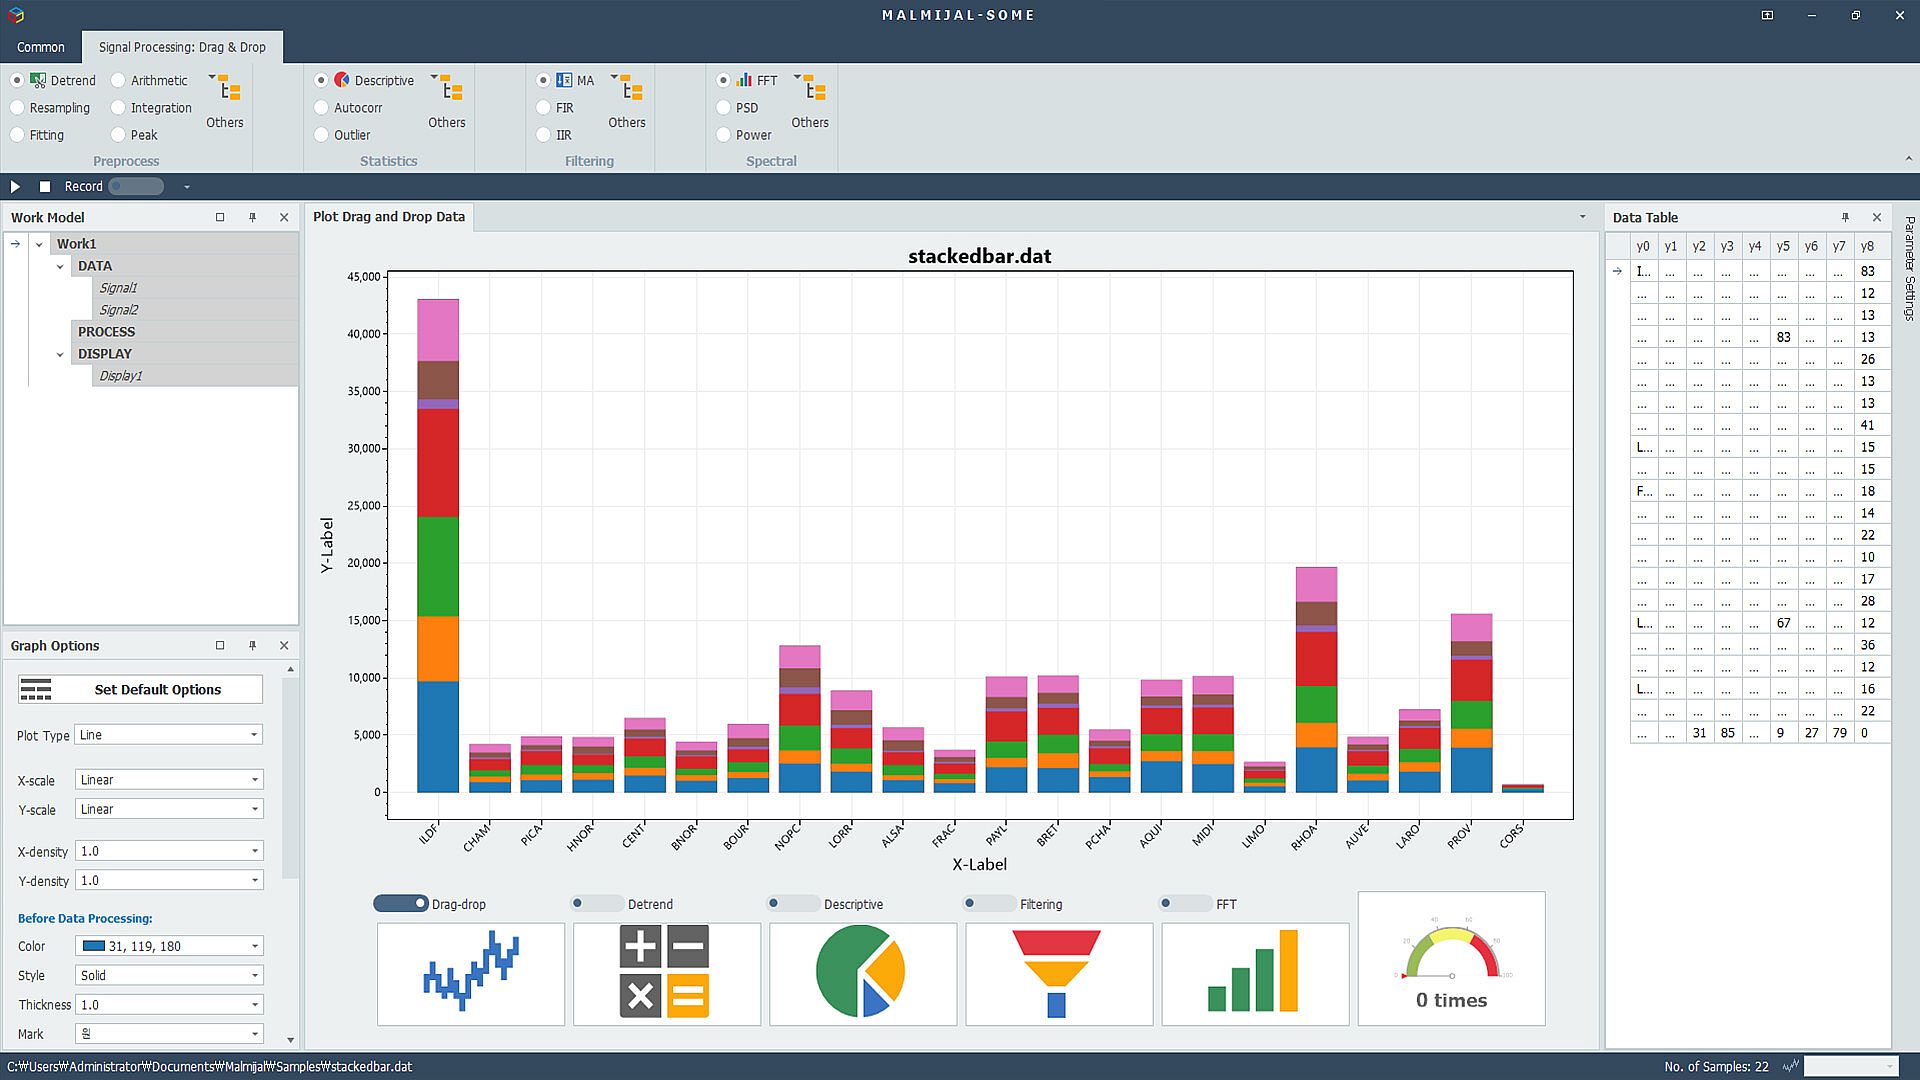
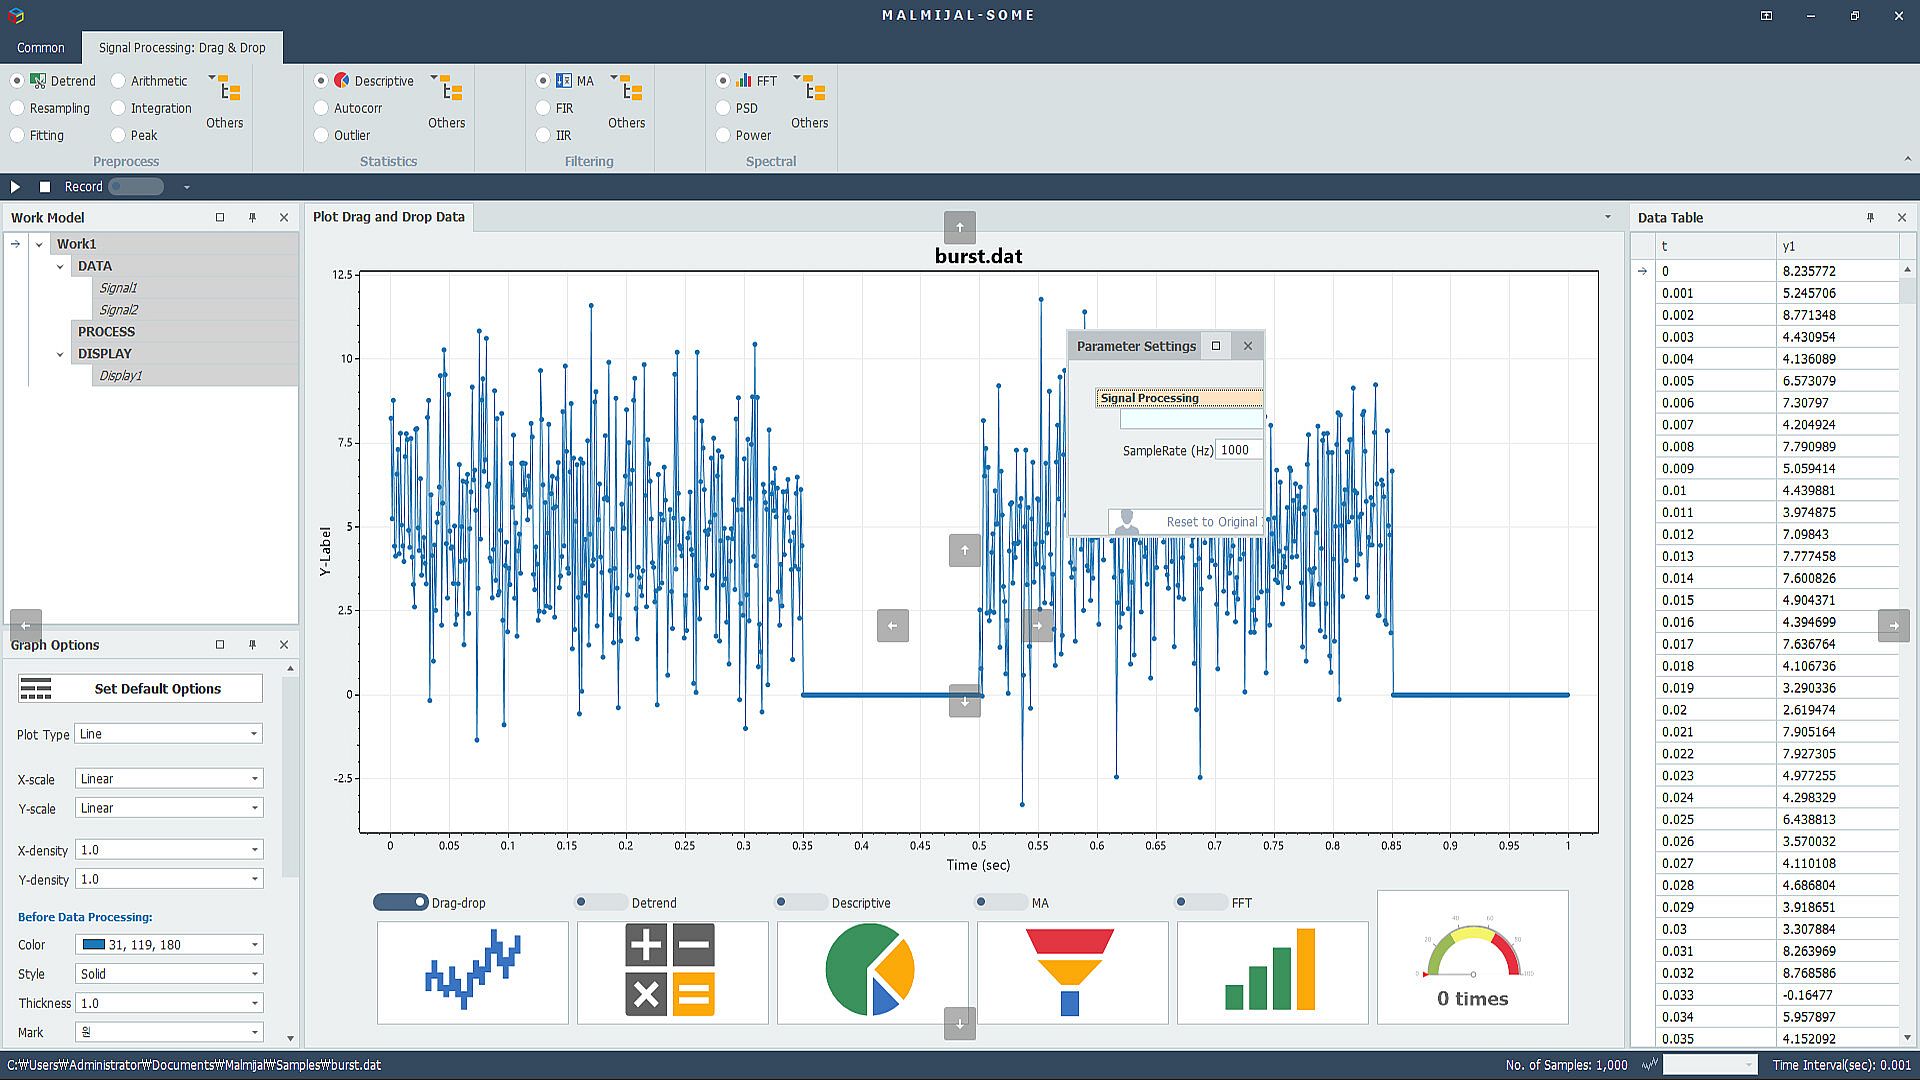
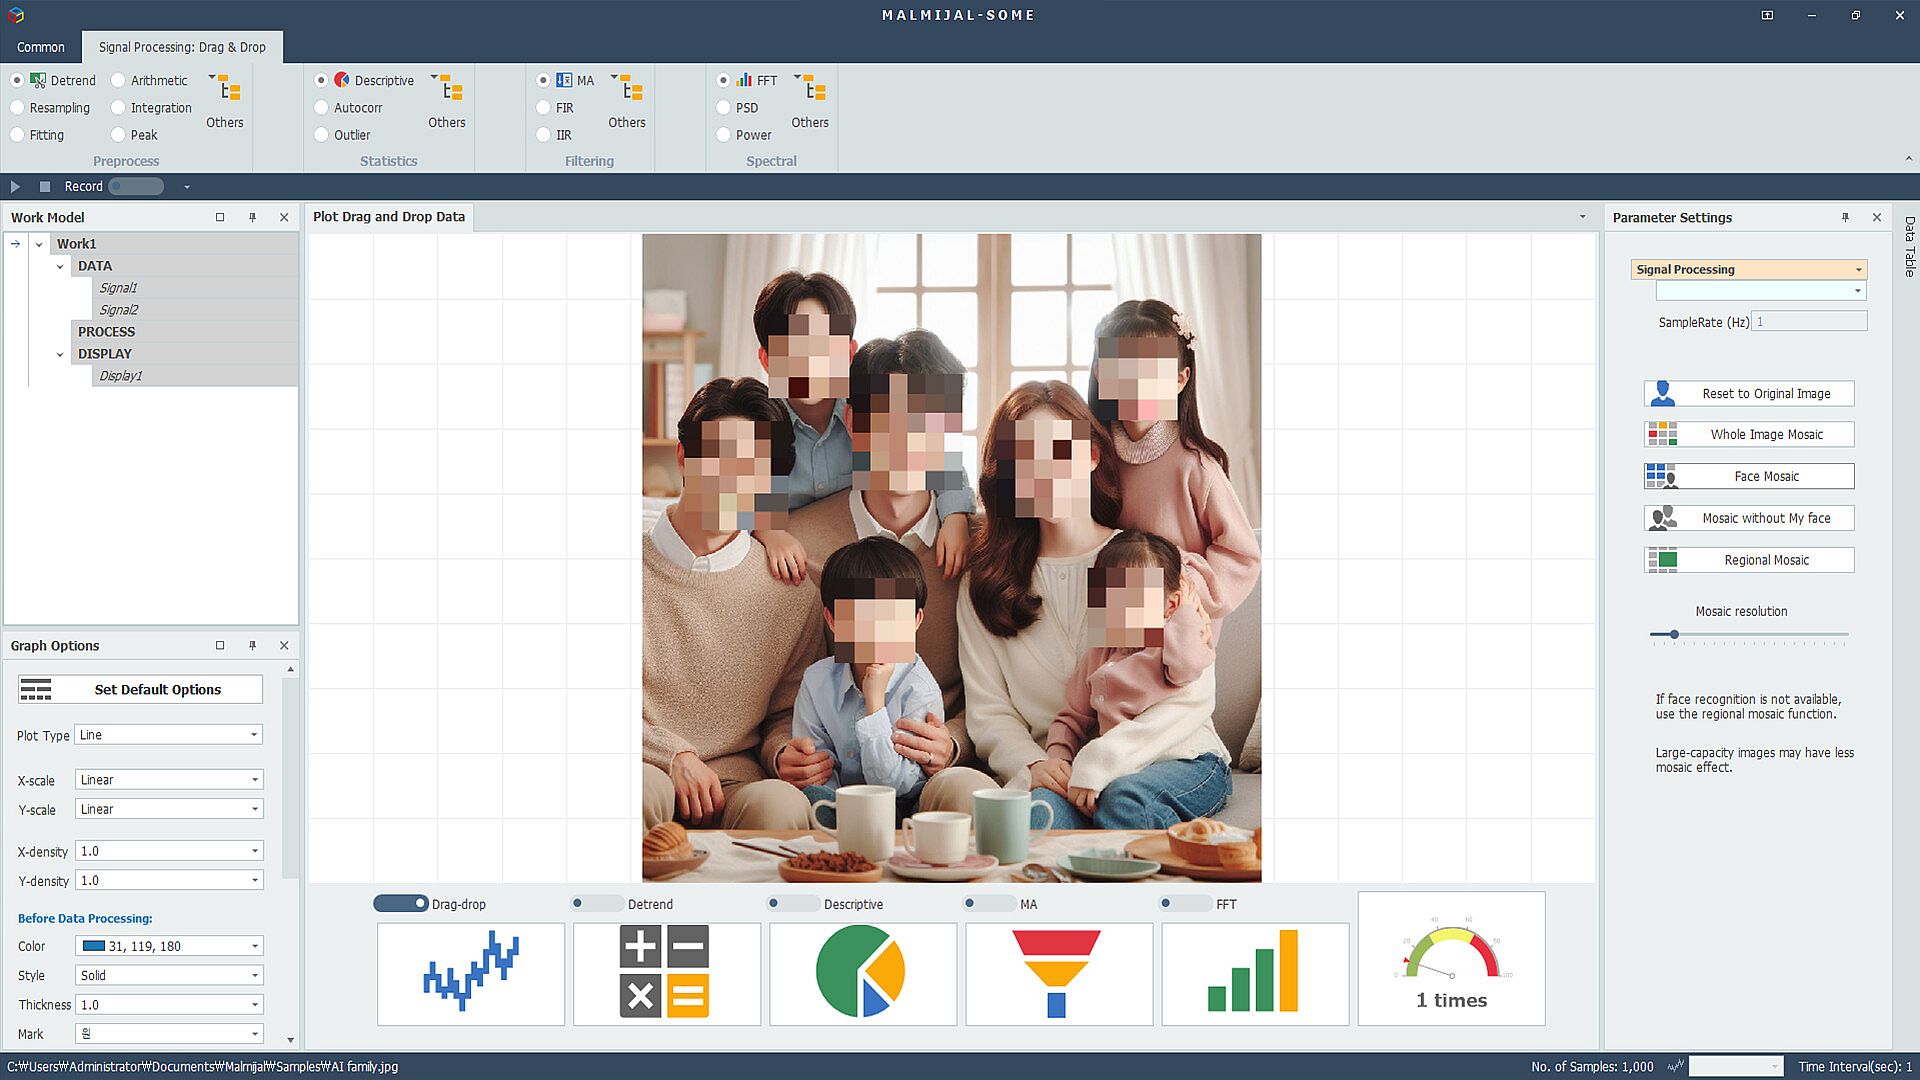
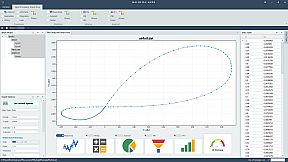
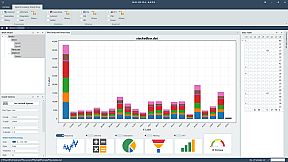
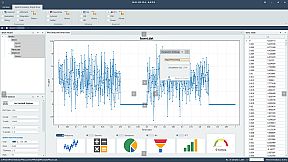
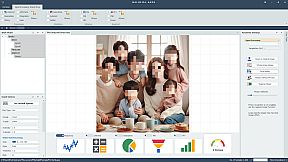
Files that can be visualized or analyzed are MATLAB numerical binary files (*.mat), Excel (*.xlsx), various audio files (*.wav, *.flac, *.mp3, ...) and text files. For graphs, depending on the data type, they are automatically displayed as bar graphs, pie graphs, or line graphs, and if they can be transformed, the graph display can be transformed, You can adjust the marker shape and size, line style, line color and thickness, and use the data cursor to know the current data value. For image files, mosaic function is possible, and only the rest of you can mosaic your face except me.
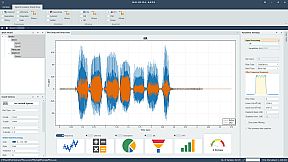
For example, after recording the whistle in the presence of background noise, the background noise can be removed using a filter, and the removed result can be confirmed by frequency analysis and sound replay. With MALMIJAL, you can quickly and easily analyze data with drag-and-drop intuitive operations, as well as participate in data analysis because it's a no-code method. In the case of background noise removal examples, you can discuss which filters to apply, filter orders, and cutoff frequencies, and then start immediately by discussing with several people. When writing a report, you can use the result graph or export it in the form of a text file for other analysis.